Application performance monitoring
In this section, I present some of my contributions to Elastic products, which are open-source. I was part of the Application Perfomance Monitoring team - the products showcased below allow developers to generate and visualize metrics, logs and traces for their software.
Elastic APM AWS Lambda Extension

In a nutshell
- Role: Programmer
- Technologies used: Go, AWS Lambda, Docker
- Learnings: Concurrency, Integrated testing, Containers, Dashboarding
- Repository: https://github.com/elastic/apm-aws-lambda
Description
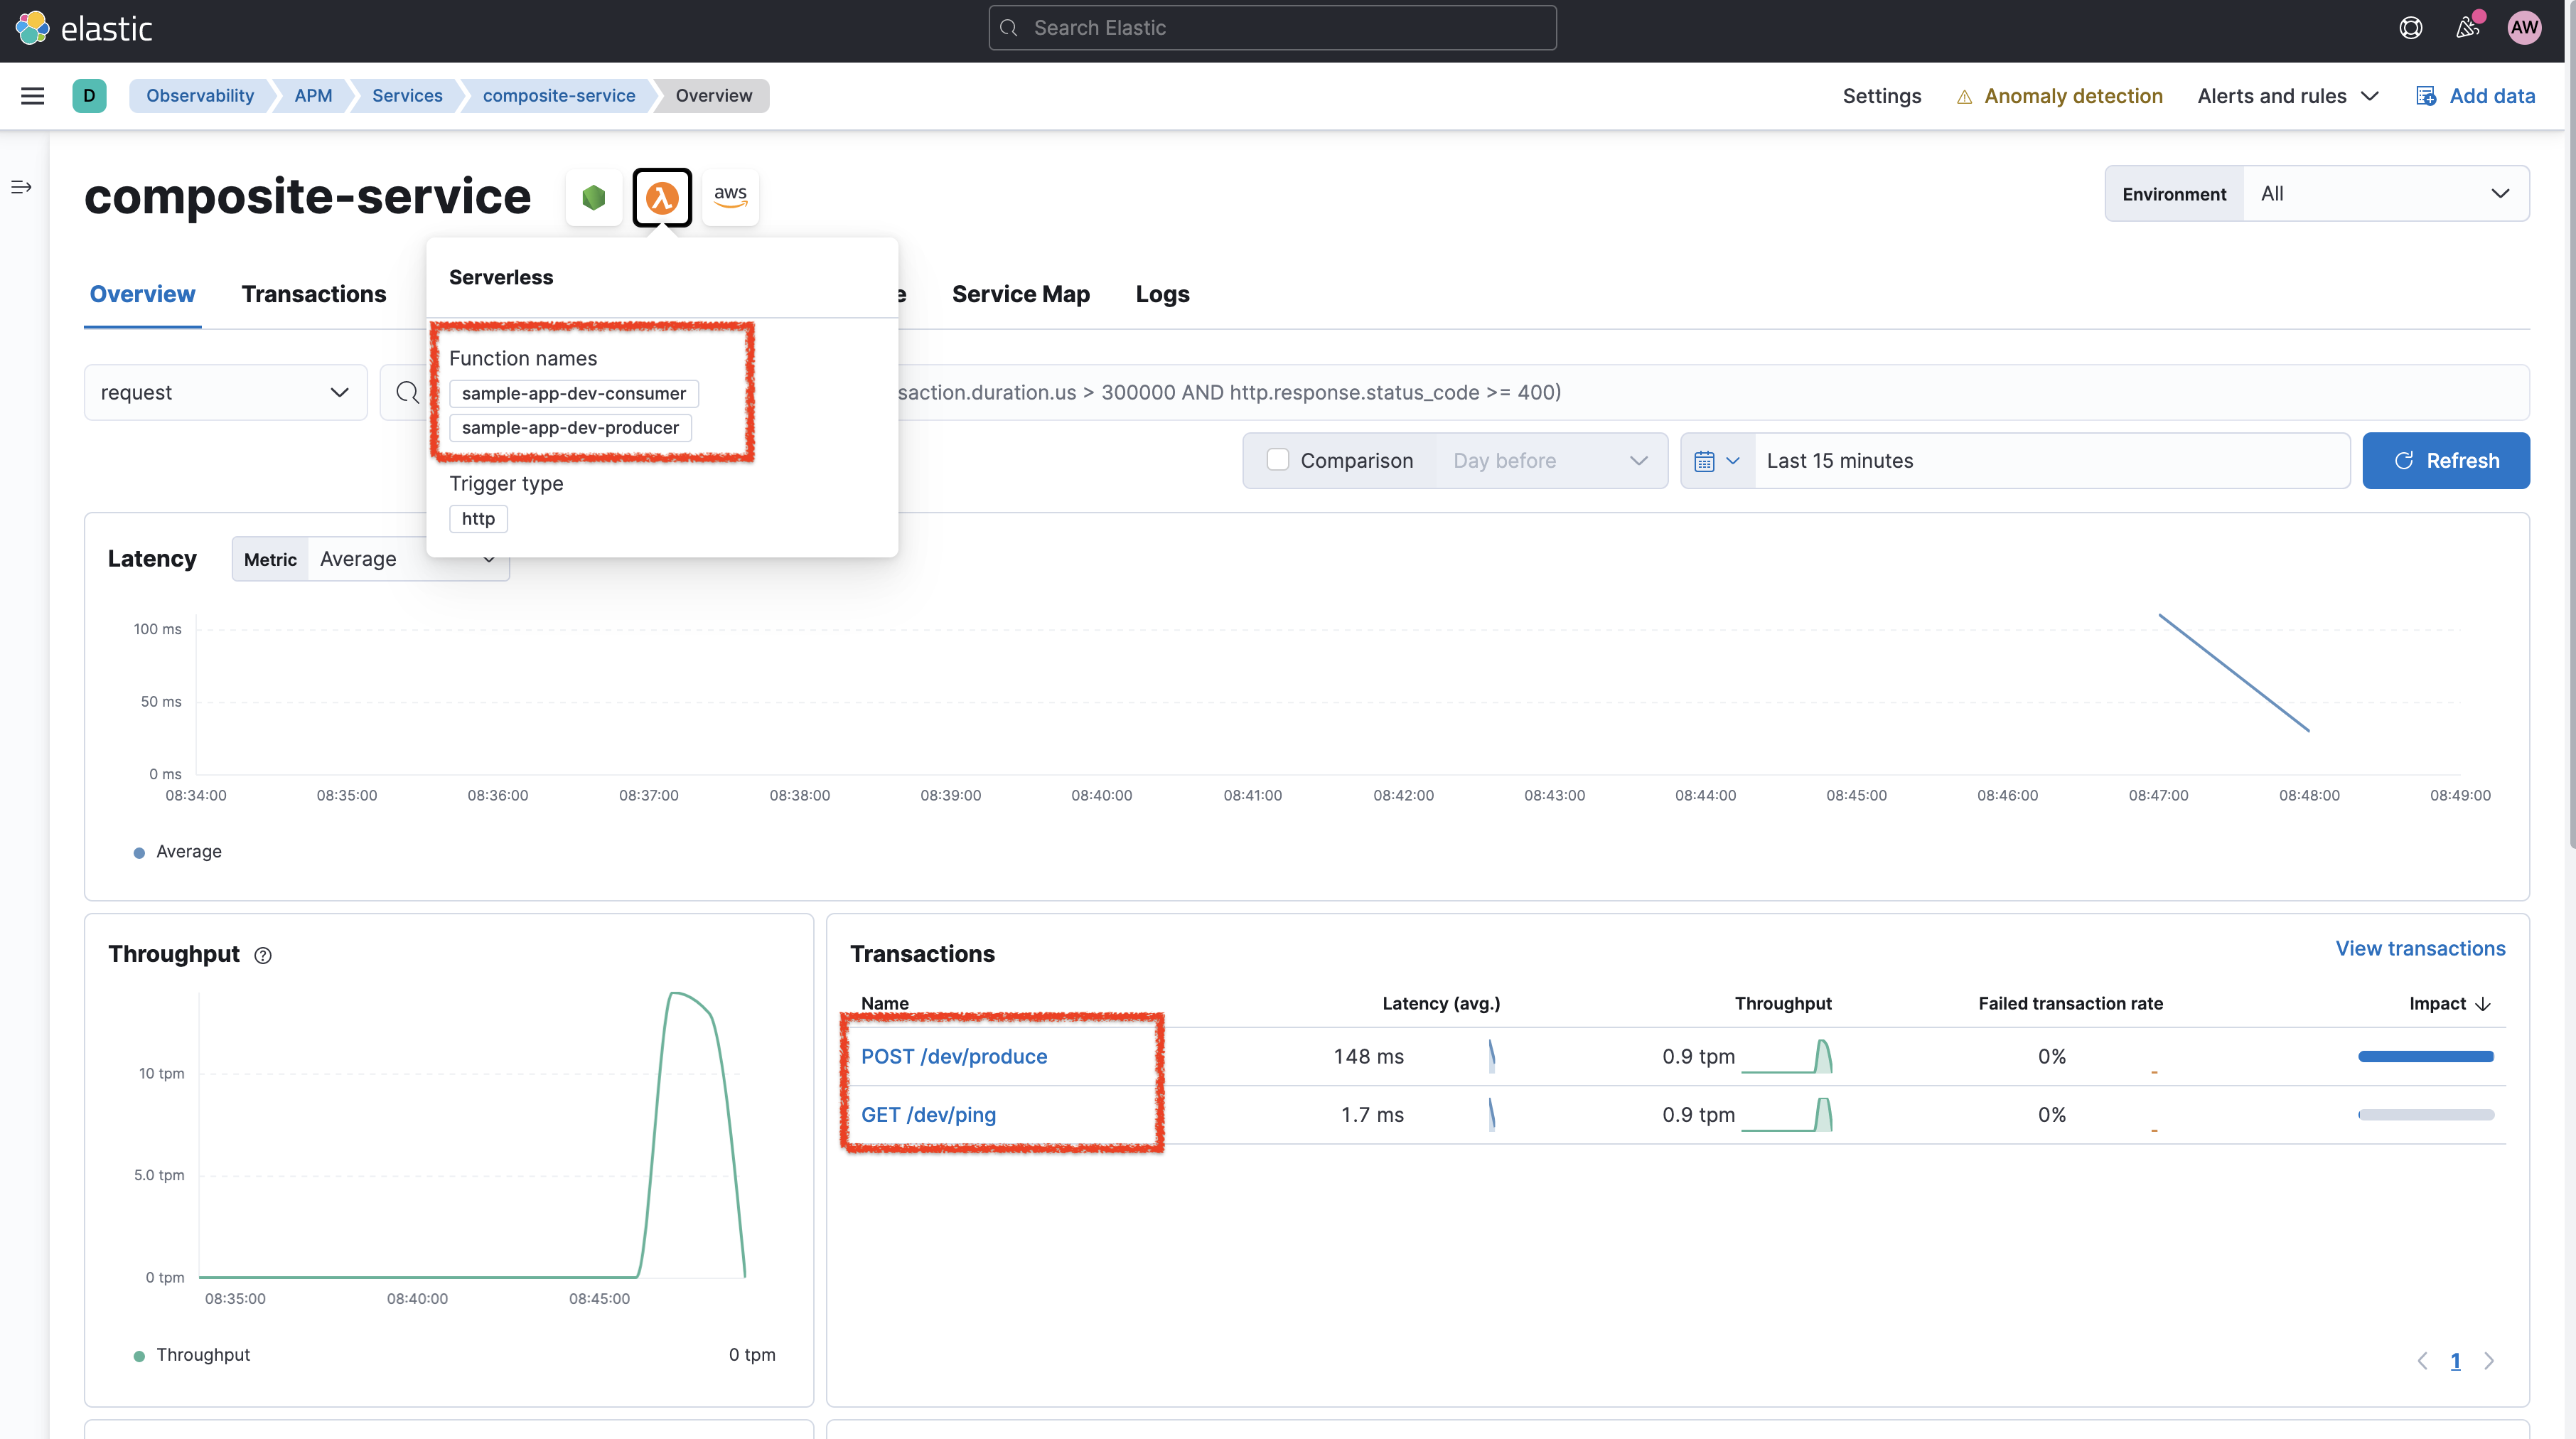
This Lambda extension runs alongside a Lambda function to generate relevant logs, traces and metrics and send them to a server. Since customers are billed proportionnally to compute time and memory consumption, the footprint of the extension should be non-existent to provide value to customers without inducing additionnal costs. Parallel execution of the Lambda function and the extension also induce concurrency challenges.
Several resources are provided by Elastic to promote and document this Lambda extension. A detailed blog post was published. The documentation explains the architecture in great detail, and official Youtube videos are available.
Source code snippets selection
My contributions are listed here. Here is a short selection of notably pull requests:
- End-to-end local testing using the AWS SAM CLI to emulate AWS Lambda locally
- Build a testing framework to validate edge-cases in the main function
- Add backoff mechanism to handle transport failure
- Generate Lambda system metrics
Elastic APM Server

In a nutshell
- Role: Programmer
- Technologies used: Go, Docker, Elasticsearch
- Learnings: Using protobuf, GPRC, and how to navigate metric-related concepts.
- Repository: https://github.com/elastic/apm-server
Description
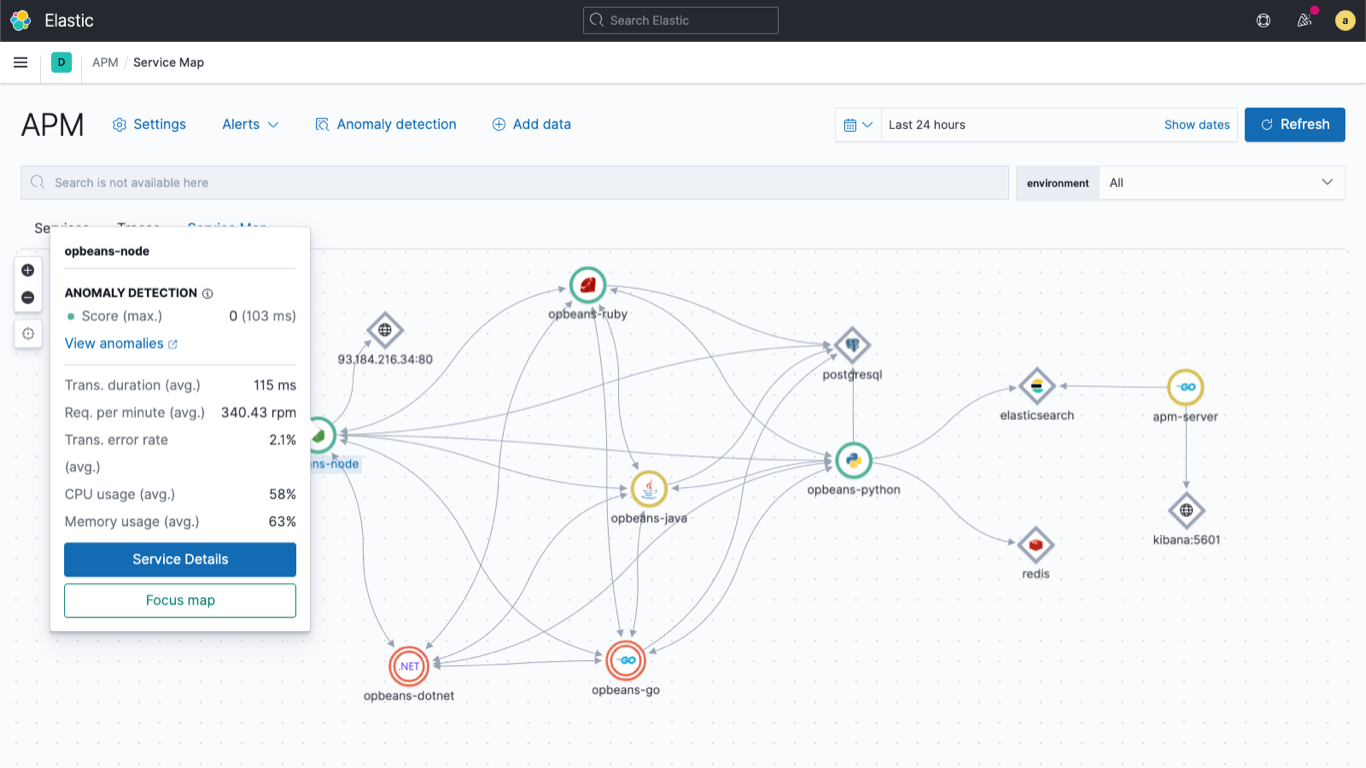
With the rise of Cloud computing and distributed systems, performance monitoring has become more complex. Generating traces, logs and metrics is not enough - those elements are now generated from distributed components, and must be correlated to provide insights and value - hence the recent growth in complexity and popularity of distributed tracing systems. The APM Server is a key component in Elastic's APM offering, as it aggregates metrics, logs and traces to store them in relevant Elasticsearch indices.
More information about Elastic APM can be found here. Regarding OpenTelemetry, it is an open-source, vendor-neutral collection of tools, APIs and SDKs to generate and collect telemetry data. Elastic observability products are compatible with OpenTelemetry out of the box - and I tried to showcase this compatibility in the publicly available APM examples.
Source code snippets selection
My contributions are listed here. They mostly revolve around improving the integration of OpenTelemetry into the Elastic APM model.